Real Estate Agent Salary in Richmond, CA: $64,018 (2026)
Quick Answer:A full-time real estate agent in Richmond, CA earns a median $64,018/year (≈ $30.77/hour) in nominal terms for 2026 — projected from BLS OEWS 2025 (SOC 41-9022). Once you factor in Richmond's price level (13% above national, BEA RPP 113.1), that paycheck buys what $56,603 would nationally. Nominal pay sits 1.9% above the California state average.
Based on BLS state-level estimates · View source
In Richmond, California, the evolving landscape of real estate has been influenced significantly by the commission structure changes following the post-2024 NAR settlement. As of 2026, the median annual salary for a real estate agent is projected to be $64,018, surpassing the national median of $53,622 by nearly 20%. Agents in this dynamic market can expect a salary range from $37,517 at the lower end to $99,228 for those at the top of their game. These figures, derived from state-level data and adjusted for regional price parities, reflect the specific economic conditions of Richmond and present a promising outlook for real estate professionals navigating this competitive environment.
About the Richmond Market
Salary estimated from California average ($92,000) adjusted for local cost of living.
Salary Breakdown
| Percentile | Annual | Hourly |
|---|---|---|
| Entry Level (P10) | $37,517 | $18.04 |
| Lower Range (P25) | $46,511 | $22.36 |
| Median (P50)(typical) | $64,018 | $30.77 |
| Upper Range (P75) | $81,943 | $39.39 |
| Top Earners (P90) | $99,228 | $47.70 |
Median Salary Position
19.39% above the national average
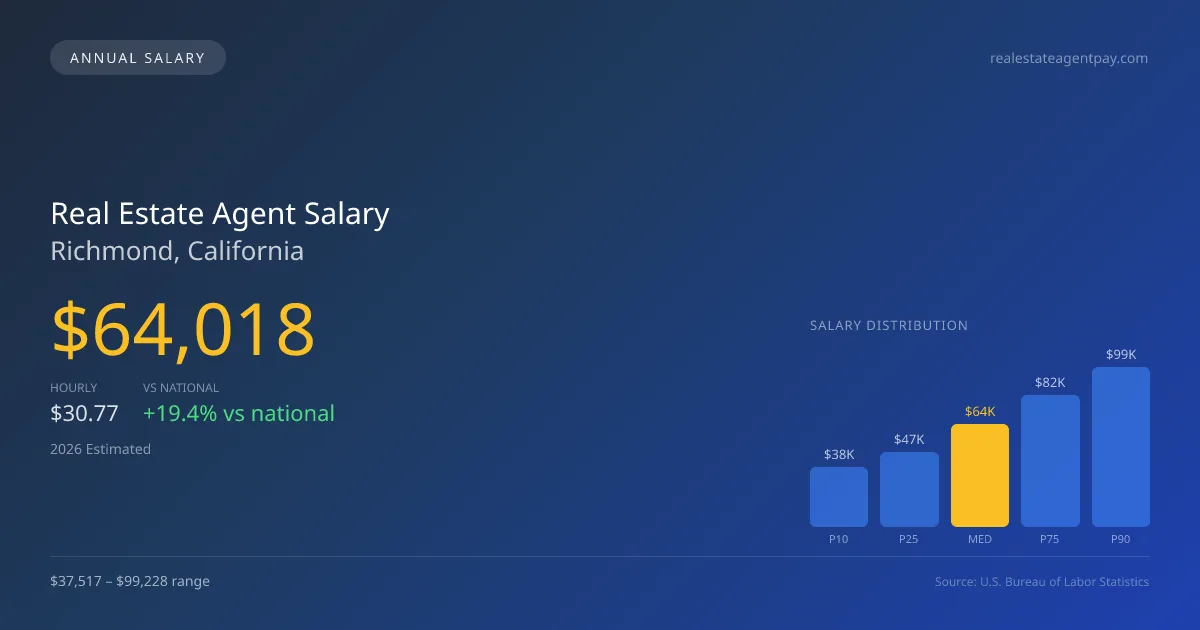
2026 Salary Percentile Distribution in Richmond
In Richmond, CA, the real estate agent salary spread from the 10th to 90th percentile is $61,711 (2026 est.). At $64,018, the local median is 19.39% above the national median of $53,622.
Salary Calculator
At 40 hours/week in Richmond: You'd be in the lower-middle range
How Richmond Real Estate Agent Pay Compares
Richmond median: $64,018/year (2026)
| Compared To | Median Salary | Richmond Pays |
|---|---|---|
| California Average | $62,824 | +1.90% more |
| National Average | $53,622 | +19.39% more |
Real Estate Agents in Richmond, CA earn a median of $64,018 per year (2026 est.), which is 19.39% higher than the national median of $53,622 and 1.90% above the California state average of $62,824.
Cost-of-Living Adjusted Salary
Richmond has a cost of living 13.10% above the national average.
Adjusted salary = nominal × (100 / CoL index). CoL index: 100 = national average.
Richmond, CA has a cost-of-living index of 113.1 (above the national average of 100). While the nominal salary of $64,018 is competitive, the higher cost of living reduces purchasing power to an effective $56,603 — a 11.58% reduction.
Compare Purchasing Power
Select a city to see how your salary compares after cost of living
Select a city above to compare purchasing power
2019 BLS Actual
$58,416
2025 BLS Actual
$63,072
2026 Current Est.
$64,018
2019–2027 Growth
+11.2%
Salary Trajectory for Real Estate Agents in Richmond (2019–2027)
2019–2025: actual BLS OEWS data for this metro area. 2026+: CAGR 1.50% projection.
| Year | Annual Salary | Status |
|---|---|---|
| 2019 | $58,416 | Actual |
| 2020 | $58,547 | Actual |
| 2021 | $57,712 | Actual |
| 2022 | $59,669 | Actual |
| 2023 | $64,827 | Actual |
| 2024 | $106,022 | Actual |
| 2025 | $63,072 | Actual |
| 2026(current) | $64,018 | Estimated |
| 2027 | $64,978 | Projected |
Based on 7 years of BLS OEWS data for the Richmond metropolitan area, the median real estate agent salary grew 8.0% from $58,416 (2019) to $63,072 (2025). At a 1.50% compound annual growth rate, salaries are projected to reach $64,978 by 2027 — a total increase of $6,562 (11.23%) from 2019.
Note: Historical values (2019–2025) are actual BLS OEWS figures for the Richmond metropolitan area, sourced from annual Occupational Employment and Wage Statistics surveys. 2026–2026 figures are current estimates, and 2027 values are projections, calculated using a 1.50% CAGR derived from 7-year BLS historical data. Actual salaries may vary based on employer, experience, certifications, and local market conditions.
Salary by Experience Level
| Experience | Estimated Salary Range |
|---|---|
| 0-2 years (New Graduate) | $37,517 – $46,511 |
| 3-5 years (Mid Career) | $46,511 – $64,018 |
| 5+ years (Experienced) | $64,018 – $81,943 |
| 10+ years (Top Earner) | $81,943 – $99,228 |
REA salary ranges estimated from BLS percentile data. Individual real estate agent compensation varies by employer, certifications, and specialization.
Real Estate Agent Job Market in Richmond
The job market in Richmond currently employs around 25 real estate agents. With a cost of living index that stands at 113.1, candidates should prepare for the reality of their take-home purchasing power in relation to their salaries. National franchise brokerages, such as Keller Williams and Coldwell Banker, tend to offer some of the most lucrative positions. Compensation discrepancies arise from various factors, including transaction volume, average sale price, and commission splits based on brokerage agreements. Furthermore, agents' success often depends on their network and ability to adapt to the shifting commission structures influenced by the recent NAR changes. For those seeking to maximize their pay in Richmond, focusing on high-value transactions and forming teams within larger firms could be strategic moves in this evolving market.
More salary data for Richmond, CA:
Frequently Asked Questions
How much do real estate agents make in Richmond, CA in 2026?
Is Richmond, CA a good place to work as a real estate agent?
Can real estate agents make $100K in Richmond?
What is the cost-of-living adjusted real estate agent salary in Richmond?
How much does a real estate agent make per hour in Richmond?
Related Pages
Compare Salaries
Career Resources
Nearby Cities in California
Written by Maria Gonzalez, REALTOR®
Career Analyst
Maria has 10 years of experience as a real estate agent. She specializes in residential properties. She works with a large brokerage in Texas.
Methodology & Data Source
Salary figures on this page are 2026 projections based on the Bureau of Labor Statistics Occupational Employment and Wage Statistics (OEWS) survey, May 2026 release. The BLS reported a median annual salary of $63,072 for real estate agentsin the Richmond metropolitan area. A 1.50% compound annual growth rate (CAGR), calculated from 6-year national BLS wage trends, was applied to project current 2026 compensation. Percentile ranges (P10–P90) represent the full salary distribution across experience levels and practice settings in this market.
Data Sources & Methodology
Salary data for Richmond is estimated from official BLS state-level occupational wage data (2025), adjusted for regional cost-of-living differences using BEA RPP (Regional Price Parities).
2026 figures are projected from 2025 BLS data using a compound annual growth rate (CAGR) of 1.50%, derived from historical BLS wage trends for real estate agents (SOC 41-9022).
Compiled and verified by Maria Gonzalez, REALTOR®, a licensed real estate agent with 10+ years of clinical experience. · View source data at BLS.gov